
How Hot is Today’s Market?
The Santa Barbara Heat Index is a snapshot of demand for single-family homes in the city of Santa Barbara described in our Multiple Listing Service as east and west of State Street.
Rather than a measurement of home sales, often lagging by at least a month, the Heat Index measures homes currently under contract but not closed, thus providing a more current picture of today’s market demand and an indication of future closed sales. And since real estate markets are seasonal and often vary monthly, today’s market is compared to this date last year. All data are from the Santa Barbara MLS and are uniformly deemed reliable.
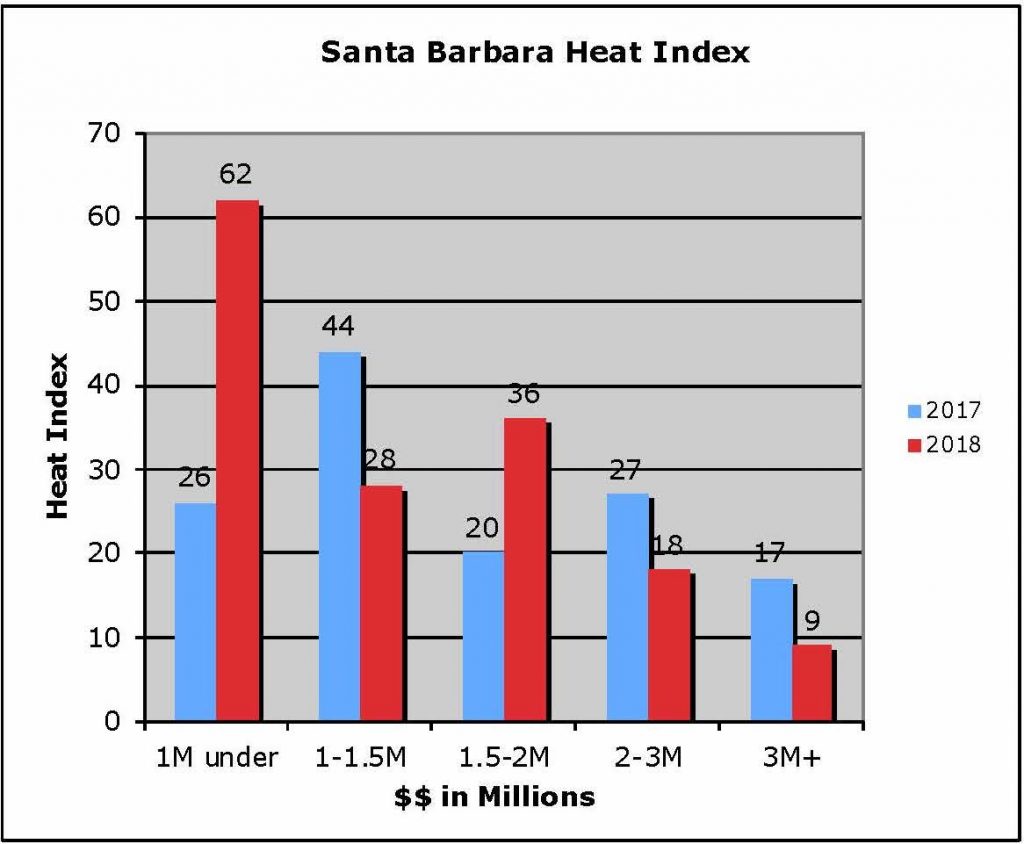
So how hot is today’s real estate market? Today’s Heat Index registers a 153. Last year for this date, the score was 134.
As the Heat graph visual demonstrates, the under $1M homes are clearly the buyers choice scoring an over-the-top 62 and claiming 40.2% of all of Santa Barbara demand. Sellers in this space are likely wishing they had more than one home to sell, yet buyers had to compete hard to win their new home. Inventory of homes for sale in this sector decreased 31% from this date last year. Huge sellers’ market for this entry-level group.
The $1M-$1.5M group fared differently. This sector scored a 28 compared to a 44 last year, a 36.3% decrease. Unlike the $1M-and-under sector, here inventory increased a significant 56.8% yet the number purchased remained the same. With more choices for buyers, sellers have fewer cards to play.
The $1.5M-$2M sector outperformed with a score of 36, exceeding last year’s score of 20 by 59.2%.
Both the $2-3M and $3M-and-over sectors underperformed compared to last year by sizable amounts both with greater inventories. The $3M+ homes scored only a 9, our lowest performing group and 47% below last year. Sellers must work harder here to get buyers’ attention going forward.
Since the first of the year, for east and west of State Street, (our metric), new homes to market have increased by 15% which buyers are always happy to see. The number sold, however, has reduced by 7% compared to this date last year. Both Eastside and Westside median sales prices have increased by 5% and 2%, respectively.
This is a fairly balanced market both on the east and west sides. Buyers generally have more choices than last year, but sellers are hanging onto their price objects and actually realized an increase from last year. Some point to this and say this points to a bubble forming. It has been a nice run for sellers, the longest growth period ever, in fact. Buyers may be starting to step back and see how this works out.
You might also be interested in...


You must be logged in to post a comment.