STSB Part 2: Results From the Bike Count Along State Street
At the last State Street Advisory Committee (SSAC) meeting, one of the biggest points of contention was cyclists on State. Members had lots of questions. Why are bikers there? Are they using it as a thoroughfare, or are they shopping on State? Is it just tourists or locals?
Both MIG, Inc., who’s been contracted by the city to create designs for State Street, as well as the city, didn’t seem to have any answers. That’s why members of Strong Towns Santa Barbara, a new local nonprofit, set out to get them.
We wrote a short, five-question survey to administer to cyclists on the street; the results can be seen below. Questions included why they were there, with the ability to choose from a range of answers including: shopping, eating, sightseeing, because it’s safer than other streets, meeting with friends, or just passing through (participants could choose more than one). We then asked their age (in decade groups), their zip code, how often they bike there, and whether or not they want to see a dedicated space for bikes in the permanent designs.
We surveyed 131 cyclists and counted 965 bikes over 8.58 hours. Some of our results are surprising and challenge the claims made by some SSAC committee members as well as those of the general public.
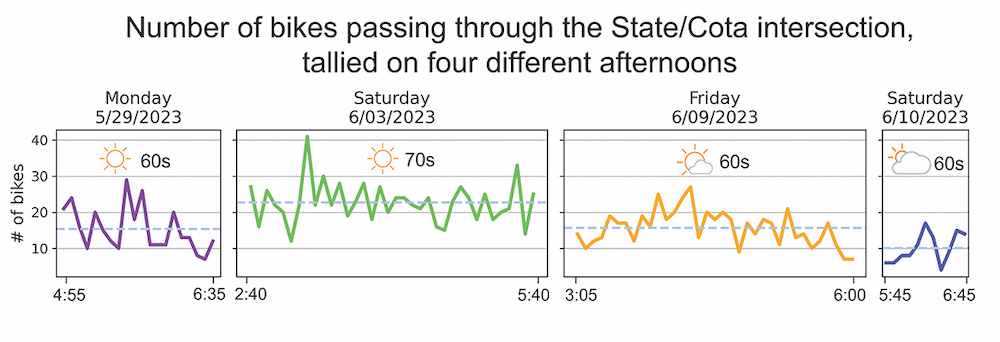
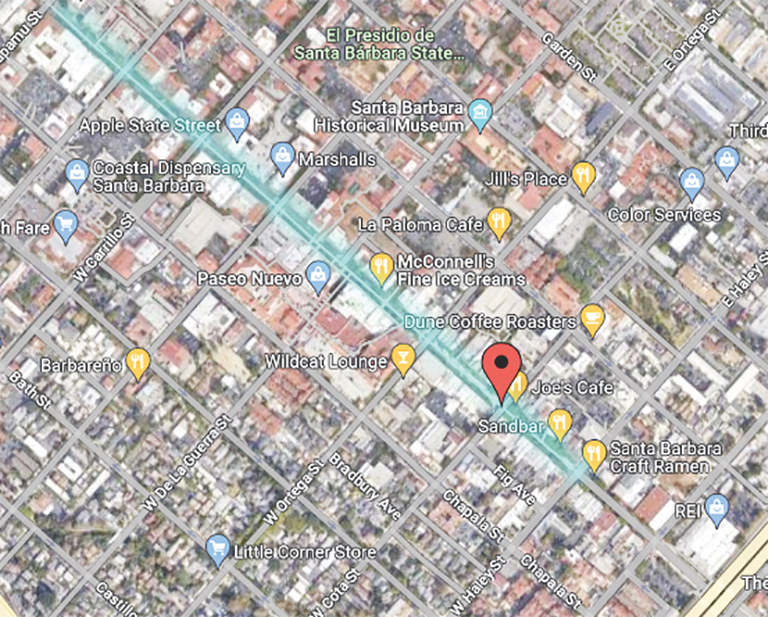
Before I share those results, let me give a disclaimer: our methods and survey were far from perfect. We only administered the survey over three days and counted bikes over four. The weather was different on those days, and the times we stood outside were different, too. We only surveyed/counted bikes at one location (the intersection of State and Cota). We also only gave the survey to cyclists, not all users of the street. We were also only able to survey a fraction of the people biking (approximately 16 percent of cyclists who passed on the three surveying days); many did not stop for us or too many came by at once. However, the goal was to understand the demographics of people who use State Street for biking, and in that I believe we succeeded. In statistics, what we got is called a “representative survey,” meaning that it represents the views of the whole population, with room for margins of error. That means that in the future, the city should try to survey the population in more depth and over more time, though that doesn’t invalidate our results. I will also add that we are a completely volunteer organization, and I am grateful to Kira, Marie, and Tristen for standing outside for hours and flagging down cyclists for the survey.
With that out of the way, let me share our findings. See image below.
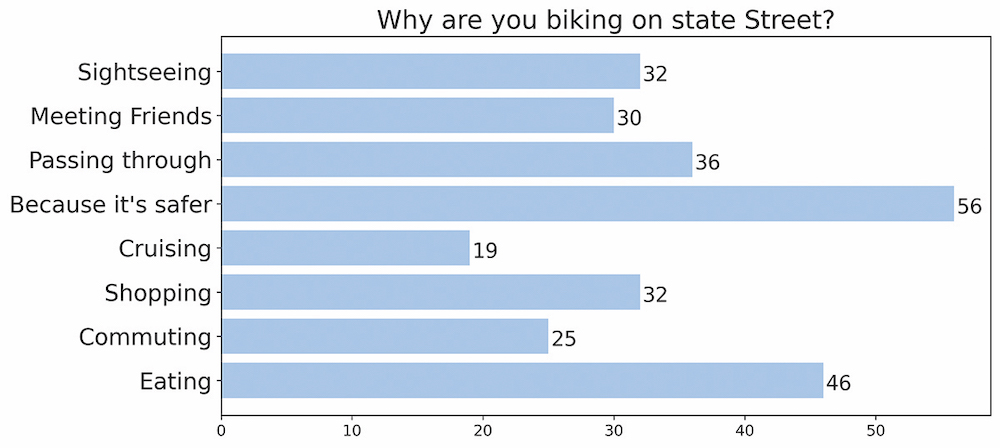
Why Are You on State Street?
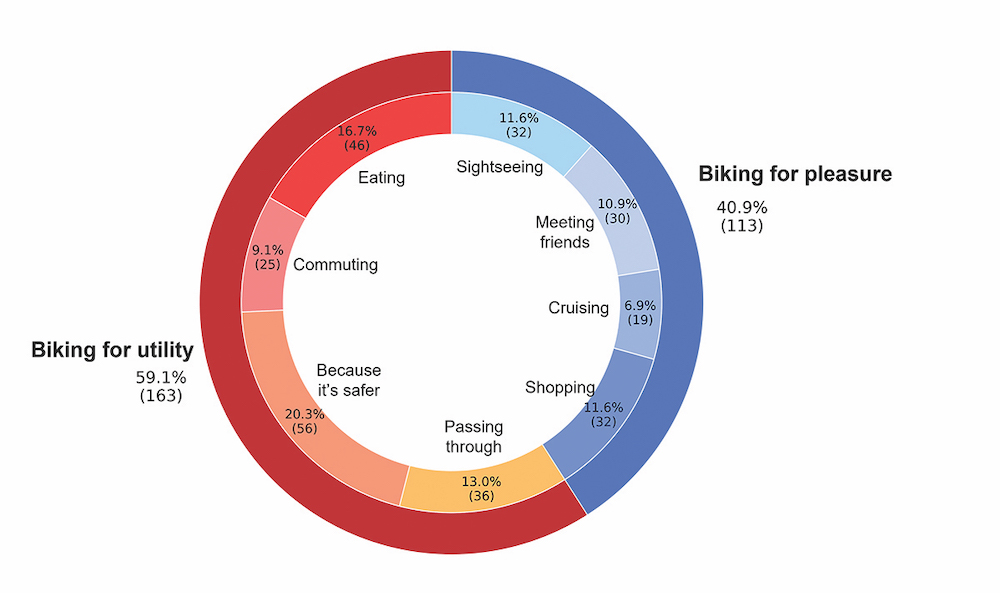
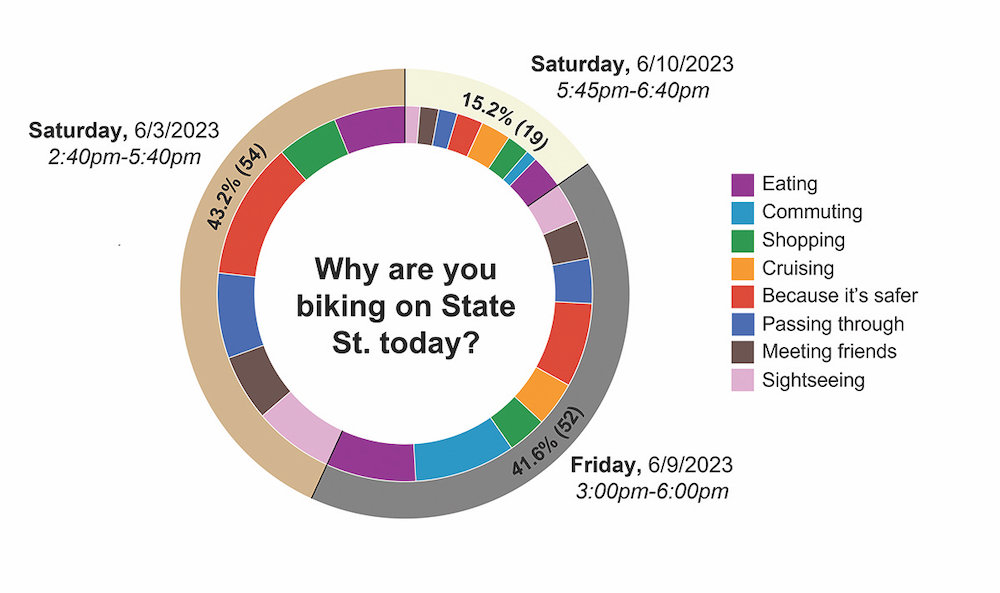
In the pie charts below, you can see the answer to perhaps the most important question we asked. On each day, shopping and eating made up between 26-32 percent of respondent activities. These activities correlate directly with spending money, so it’s safe to say that at least a third of people biking down State Street are adding to business revenue.
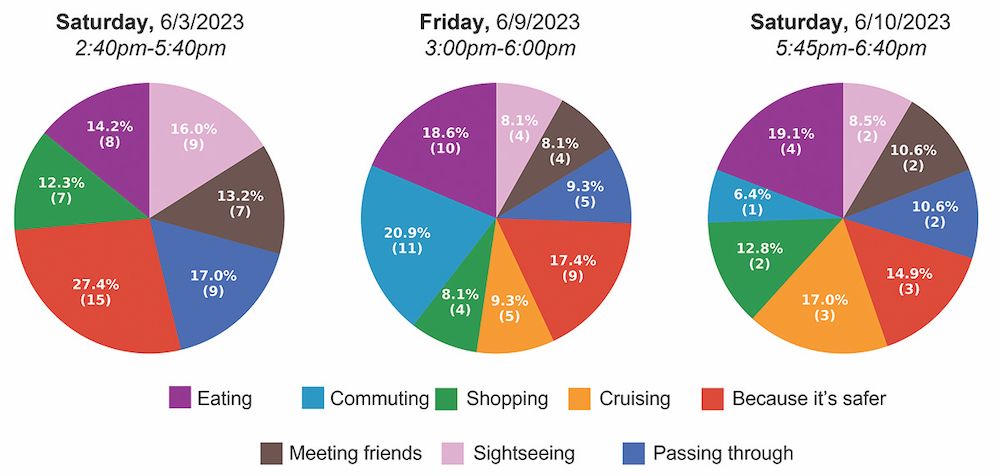
Another important takeaway is how many people are sightseeing and cruising. State Street is one of the most beautiful main streets in America, and tourists and locals alike are coming here to view the sights. That means that if bikes were diverted to Anacapa or Chapala streets, as some have suggested, bike volume would surely decrease.
Perhaps the most important result is how many people told us they’re biking on State because they feel that it’s safer than the alternatives. Many studies have shown that the greatest factor contributing to Americans not biking is a lack of safe infrastructure and a perception of danger. The new State, with its complete lack of deadly automobiles, is the ideal place for cyclists who would be afraid to ride elsewhere, once again providing reason to not divert them to other streets.
These insights show that State is not being used as a “thoroughfare” as one of the SSAC members suggested. Cyclists on State are traveling to local businesses on the corridor, socializing, sightseeing, and feeling safe while they do so.
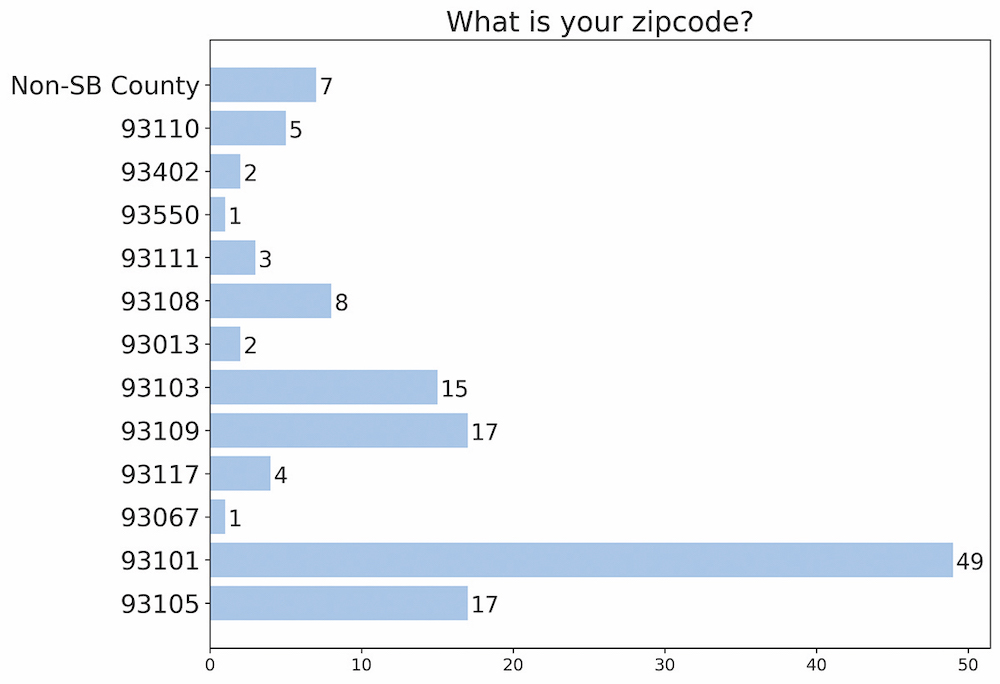
Where Are You From?
This question was meant to understand the balance of tourists vs. locals. It seems that most cyclists live within the same zip code as State Street, with the vast majority living in Santa Barbara.
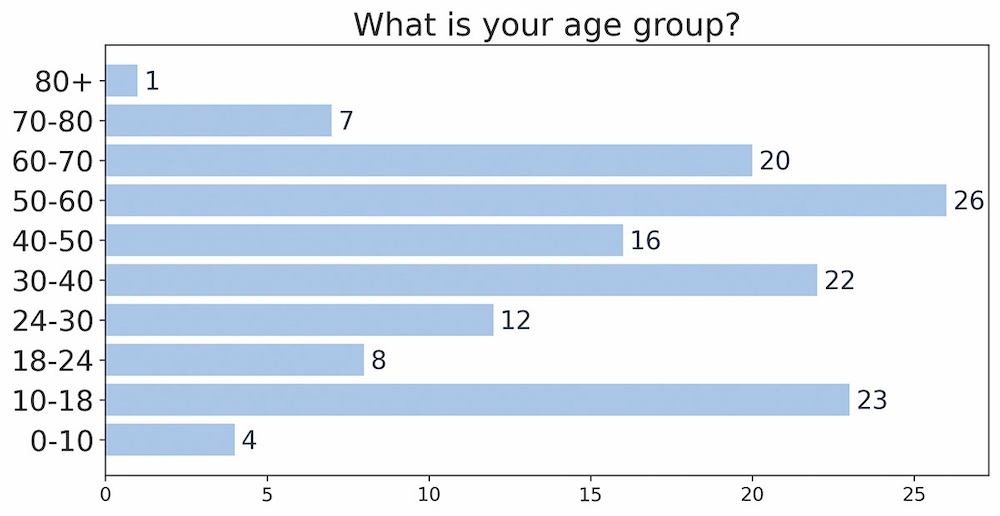
How Old Are You?
Without getting too personal, we asked how old the cyclists were. The largest age group was 50-60, with ages 10-19 coming in second, and 30-40 not far behind. There were also cyclists under 10 and over 80. This spread shows that a variety of people are biking, not just teenagers.
How Often?
Our last question found that a third of users bike on State every day, with frequency decreasing in percent of answers.
Conclusion
While our survey was far from perfect, the conclusions are pertinent to the conversation surrounding the future of State Street. A bike culture, which includes people of all ages doing various activities from hanging out to commuting, has developed along this beautiful street. In line with many other studies on the subject, we found that cyclists spend money at local shops. These cyclists feel safe here, which is the most important aspect of moving people from their cars to bikes. With about two bikes per minute on average, this bike phenomenon should be celebrated and worked into the permanent plan for State Street.
Next week, I’ll address some of the concerns expressed by the SSAC, and explore how many of them can be addressed through smart urban design.
Until next time,
Sully Israel
You might also be interested in...