
The Montecito Debris Flow One Year Later: Housing Market Impact and Recovery
The Thomas Fire and subsequent debris flow on 9 January 2018 devastated portions of Montecito and surrounding communities. The debris flow killed 23 people and damaged or destroyed hundreds of homes and commercial properties. As of April 2018, insurance claims total $421.9 million, including 107 homes declared total losses (California Department of Insurance, 2018). Those affected have demonstrated remarkable resilience in the year since the debris flow. Many residents whose homes were damaged are determined to rebuild despite the risk of future disasters. This report analyzes the effects of the debris flow and subsequent recovery on residential sales, sales prices, and building activity. For an analysis of the debris flow’s impacts on the rental market, please see our companion report, Disaster Premiums in the Rental Housing Market: Exploring the Effect of the Montecito Debris Flow (Robert D. Niehaus, Inc., 2019).
Based on industry data published by Zillow (2019) and the Santa Barbara County Assessor (2019b), total home sales in Montecito fell an estimated 25.5 percent between 2017 and 2018. Most of this reduction was concentrated in the first two months following the debris flow. Over the same period, annual home sales in the City of Santa Barbara and Santa Barbara County as a whole were essentially unchanged.
Though sales in Montecito have shown signs of recovery in recent months, local realtors interviewed for this study report that they are still wary of buying/selling properties in the “red zone,” i.e. areas in Montecito and Carpinteria that County officials have determined are at significant risk of future debris flows. Our analysis of recent home sales indicates that the value of homes in the red zone has declined 25.9 percent since the debris flow whereas the value of homes outside the red zone has increased by 9.6 percent.
This report also examines building permit data to gauge the current progress of reconstruction efforts. Of the 271 parcels with homes that were moderately or severely damaged by the debris flow (i.e. homes that initially received a Yellow Tag or Red Tag), 145 have been issued permits to demolish, rebuild, and/or repair all or some of their structures. Most permitted demolition projects have been completed; however, 38.5 percent of the demolition projects and 78.8 percent of the permitted repair/rebuilding projects are still underway.
Home Sales
RDN conducted interviews with local realtors, property managers, builders, and insurance agents to learn their perspectives on how the debris flow has affected the housing market. While most property managers suggested that the debris flow did not significantly affect their business, realtors reported a slow-down for several months immediately following the event.
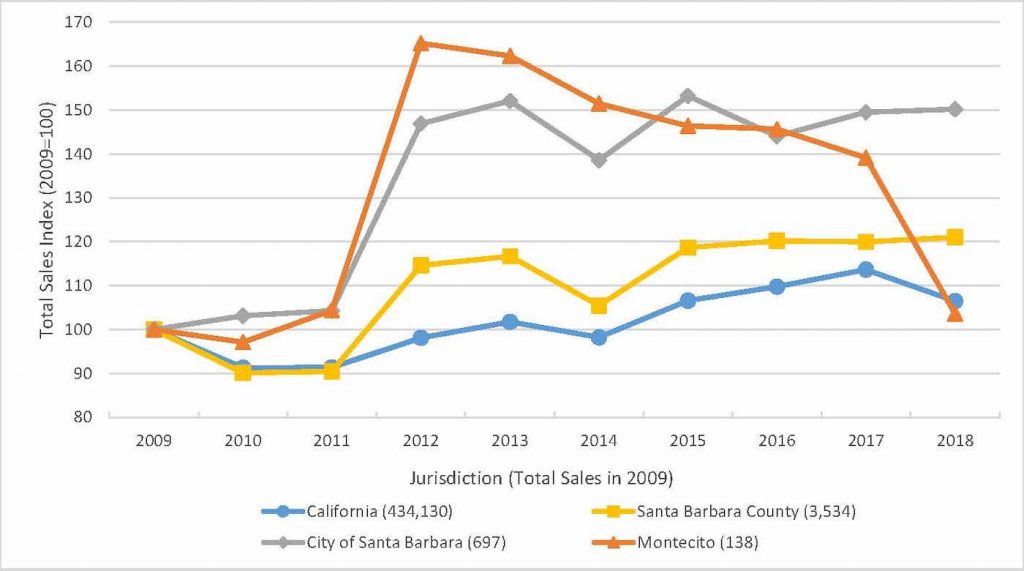
Sales statistics support the slow-down in housing sales reported by realtors. Figure 1 displays the recent trend in annual home sales for Montecito, the City of Santa Barbara, Santa Barbara County, and California as a whole (values are indexed relative to 2009 levels). Total sales in Montecito and the City of Santa Barbara increased sharply in 2012. While sales in Montecito fell an average of 3.4 percent each year between 2012 and 2017, they dropped 25.5 percent in 2018 after the debris flow. In contrast, annual sales in 2018 for the City and County of Santa Barbara grew 0.5 percent and 0.9 percent, respectively.
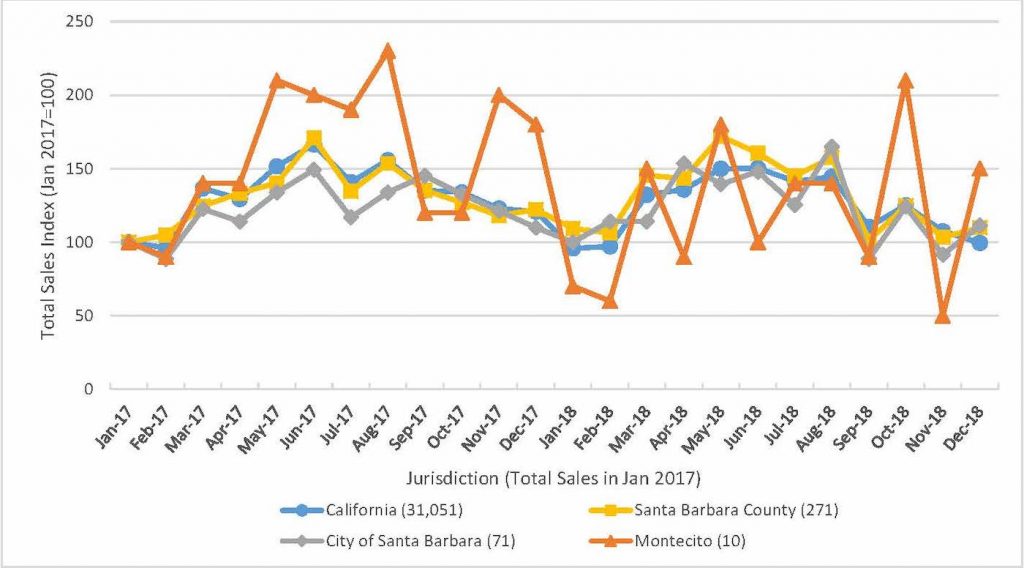
Although total sales in Montecito declined sharply in 2018, the disruption was not evenly spread throughout the year. Several realtors reported a severe slow-down for four to six months following the January debris flow, but also indicated that an overall attractive market and pent-up demand spurred sales in the later part of the year. Figure 2 displays monthly home sales for 2017 and 2018 indexed to January 2017. As of this report’s publication, Zillow’s sales data for Montecito is currently only available through October 2018 – data for November and December 2018 are estimated based on transaction-level data published by the Santa Barbara County Assessor (2019b).
Sales volumes in Montecito are volatile given the relatively low inventory, but the market has shown signs of recovery in recent months – albeit with continued volatility. Additionally, realtors interviewed for this study report an asymmetry in the sales volume and prices of homes inside and outside of the debris flow risk area, or “red zone,” which the County finalized on 3 December 2018 (Santa Barbara County Office of Emergency Management, 2018; Santa Barbara County Department of Planning & Development, 2019a). While the market for houses outside of the red zone has for the most part returned to normal, multiple realtors said that the debris flow has caused prospective buyers (and insurance companies) to reevaluate their perceptions of risk for homes within the red zone. Many realtors are hesitant or unwilling to show and sell homes in the red zone until new building/zoning requirements are finalized and the homes are fitted to withstand future debris flows and/or flooding events.
The slowdown in sales in the red zone may be further exacerbated by changes in the fire and flood insurance market. Several insurance representatives reported that it is now more difficult to obtain insurance for homes in the red zone, and that some existing policies are unlikely to be renewed. According to one insurance agent, non-renewal rates are already on the rise for homes in high risk areas.
Sales Prices
Montecito’s rebound in housing sales in the later part of 2018 speaks to the coastal community’s appeal. The allure of living in the Montecito area did not disappear after the tragedy, which is why many of those affected by the debris flow chose to remain on the South Coast. Of the industry professionals RDN interviewed, roughly 85 percent suggested that everyone they knew that was affected by the debris flow chose to remain nearby, mostly in Montecito, but also with some movement to Hope Ranch and Goleta. Reported migrations away from the area were fueled by people who were approaching major life events such as retirement, and the debris flow was the catalyst which propelled them to move away from Montecito.
Realtors interviewed for this study stated that the housing market in Montecito is currently strong and that prices have generally recovered from their dip immediately following the debris flow. However, as discussed in the previous section, the price of any single home may partially depend on whether the home is inside or outside of the red zone. To estimate this effect, we examined transaction-level data for all arms-length home sales in Montecito and Carpinteria between late 2016 and March 2019 (Santa Barbara County Assessor, 2019b). Using econometric techniques to control for each home’s unique physical characteristics, such as year built, square footage, and lot size, we modeled the change in sales prices of single-family houses and condos sold in Montecito and Carpinteria before and after the debris flow, depending on whether they are inside or outside of the red zone. The blue and orange bars in Figure 3 show the model’s predicted average sales prices for homes sold before and after the debris flow, respectively. The black error bars correspond to 95 percent confidence intervals.
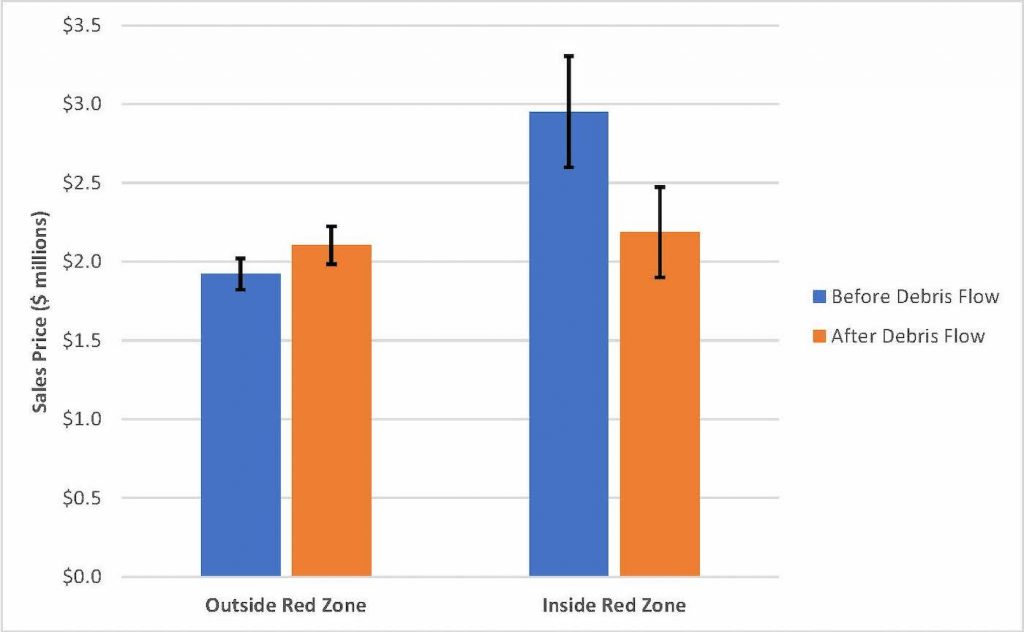
In line with the feedback from local realtors, Figure 3 supports the assertion that the debris flow had asymmetric effects on sales prices depending on a homes’ location. These changes are also statistically significant at the 95 percent level. In percentage terms, the model predicts that the average sales price of homes and condominiums outside the red zone increased 9.6 percent after the debris flow. The 95 percent confidence interval for this change ranges from 1.4 to 18.3 percent. In contrast, the model predicts that the average sales price of homes and condominiums inside the red zone fell 25.9 percent after the debris flow. The 95 percent confidence interval for this change ranges from -38.0 to -11.5 percent. Note this model also excludes any parcels that were both inspected for damage and sold after the debris flow, as those homes are in various stages of reconstruction. The factors affecting the timing and price of properties directly affected by the debris flow are likely different than the broader market of homes in and out of the red zone that were not affected.
Rebuilding Efforts
Santa Barbara County’s Building & Safety Department conducted initial damage assessments for 633 structures following the debris flow and are tracking their repair and reconstruction (Santa Barbara County Department of Planning & Development, 2019a). These structures comprise 506 homes, 32 businesses (including hotels), and 95 outbuildings (garages, barns, etc.). Out of the 506 homes inspected, 165 initially received a Red Tag (typically 60-100% damage), 144 received a Yellow Tag (typically 10-60% damage), and the remaining 197 received a Green Tag (typically 0-10% damage). Properties with a Red Tag are uninhabitable, whereas Yellow Tags may allow for restricted use. Homes with Green Tags are deemed safe and cleared for occupancy (County of Santa Barbara Building & Safety, 2019).
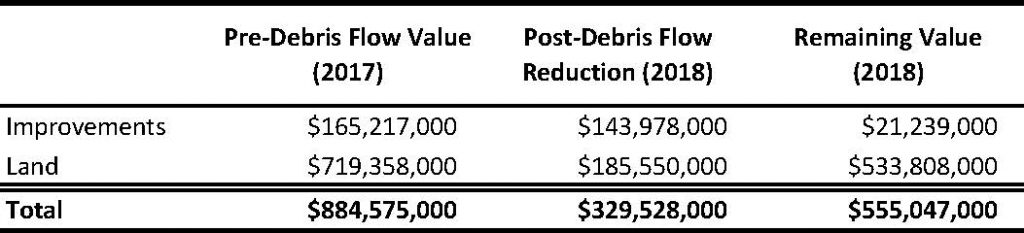
The County Assessor’s office reduced the total assessed values of affected properties from $885 million in fiscal year 2017 to $555 million in fiscal year 2018, for a total reduction of $330 million. This total includes damages to residential and commercial properties but excludes another $42 million in combined damage to the Four Seasons Biltmore and San Ysidro Ranch hotels. Broken down by type, the damages include $186 million to land and $144 million to structures (Table 1).
Properties affected by the debris flow are eligible for a fast-tracked permitting process to rebuild. The County’s disaster recovery policy allows affected homeowners to rebuild up to their original square footage without impacting their assessed values. Owners who choose to rebuild a larger home than what was on the site prior to the disaster are only reassessed on the portions of the structure which exceed the previous footprint.
Figure 4 maps residential properties in Montecito with their initial (January 2018) and updated (January 2019) inspection status, for all dwellings that were damaged by the debris flow. The map illustrates that many homes have changed status over the last year, especially homes in the Coast Village Road neighborhood located in southeastern Montecito north of US Highway 101.
Figure 5 presents a snapshot of how the status of these homes has changed in the year since the debris flow (from January 2018 to January 2019). Of the 165 homes that initially received a Red Tag, 105 (64 percent) have since changed to a Yellow or Green Tag. Out of the 144 homes that initially received a Yellow Tag, 79 (55 percent) have since changed to a Green Tag.
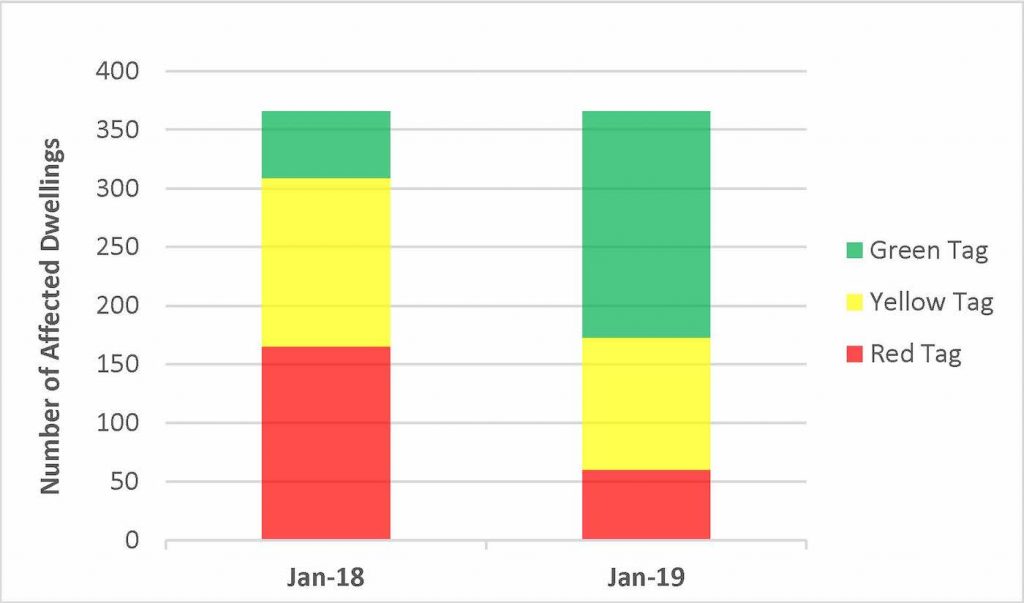
Note that a change from a Red or Yellow Tag to a Green Tag can indicate that significant repairs have been made; however, it may also indicate that a home has been demolished and the lot is now cleared as vacant land. Further analysis of the permitting activity elucidates the type of activity that prompted a change in inspection status.
RDN collected permitting data from the Santa Barbara County Department of Planning and Development for all affected parcels initially tagged Yellow or Red (Santa Barbara County Department of Planning & Development, 2019b). Because each parcel may have more than one dwelling, the 309 dwellings initially tagged Yellow or Red (see Figure 5) comprise only 271 unique parcels. The Santa Barbara County Building and Planning website provides a database of all permits associated with each parcel; each permit entry provides a date, project name, and status, and other supplemental information. All parcels included in this analysis have a permit with some form of the project name “Montecito Mudslide – January 2018.” The file date for nearly all of these permits is between 23 January 2018 and 26 January 2018, though a few permits were filed later in 2018.
Most parcels affected by the debris flow have since filed recovery-related permits. Permit project names provide information regarding the actions undertaken by the property owners. For example, a common project name in the permit data is “Partial Demo SFD,” indicating a partial demolition of a single-family dwelling occurring on the parcel. Projects are filed into distinct categories, including “demolitions,” “repairs,” “rebuilds,” and “remodels.” The County Building Department confirmed that demolitions, repairs, and rebuilds at affected parcels were likely connected to post-debris flow recovery efforts, while any remodels likely represented unrelated building activity.
In addition to information about the type of construction, the permit database includes the date the permit was issued, as well its current status. When a project has been completed and inspected, the permit is marked “closed.” We classified projects as “complete” if the associated permits are “closed,” and classified projects as “in progress” if the associated permits have any other status. For parcels with multiple projects of the same activity – i.e., multiple demolition projects – we classified the projects as complete when all demolition permits have been “closed” and classified the projects as “in progress” under any other circumstance.
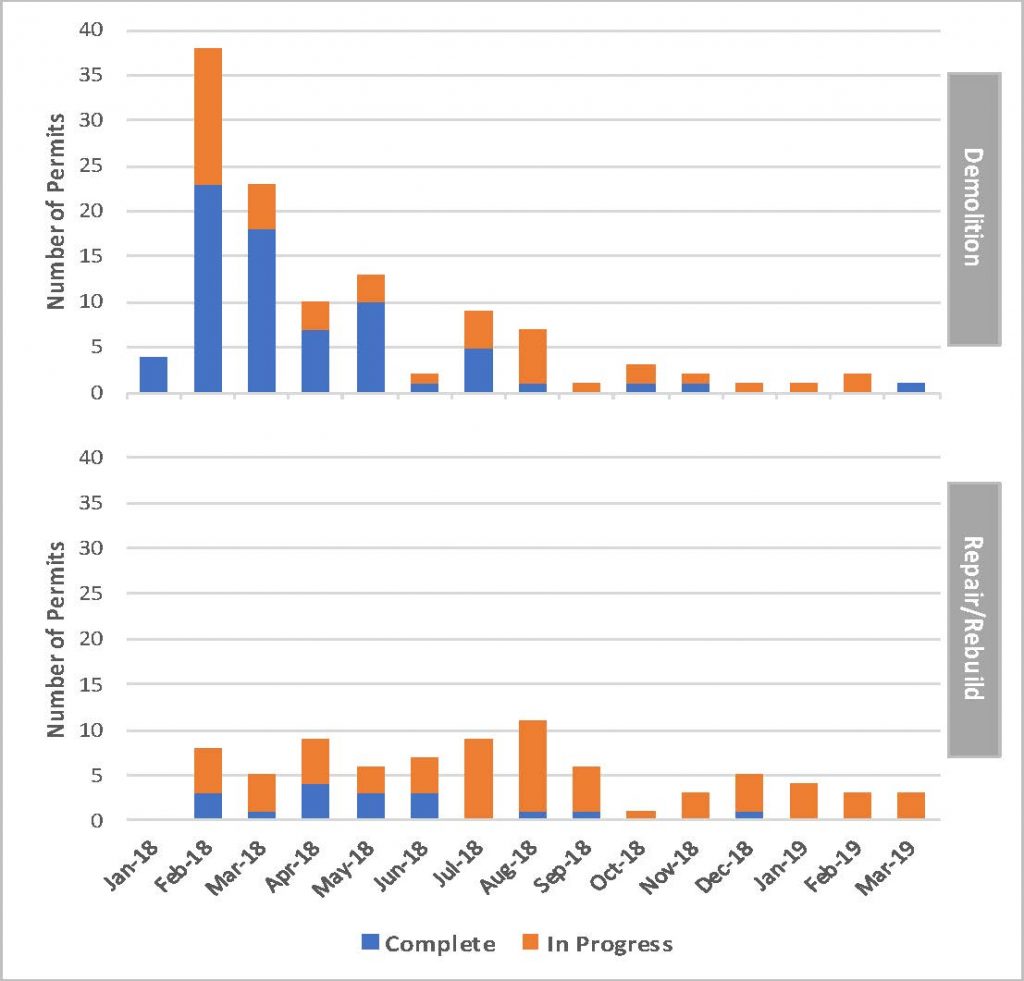
Figure 6 displays a timeline of projects associated with the debris flow by type and date the permit was issued. The chart illustrates the high number of demolition permits issued immediately following the debris flow. In February 2018 alone, 38 demolition permits were issued. Demolition permits fell significantly in September 2018, after which no more than five demolition permits have been filed per month. As of March 2019, most of the demolitions have been completed. In contrast, most repair/rebuilding projects are still in progress.
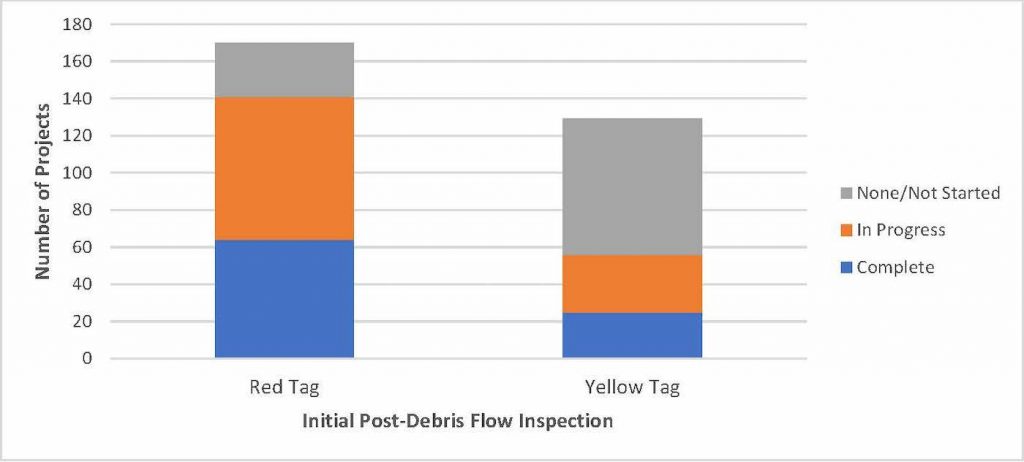
The findings in Figure 6 indicate that Montecito is likely not as far along in the rebuilding process as the change in inspection status might otherwise suggest. To explore this further, Figure 7 displays a snapshot as of March 2019 of the status of all reconstruction projects (demolitions, repairs, and rebuilds) for parcels that initially received a Red Tag or Yellow Tag due to damage from the debris flow. Despite these projects, many damaged parcels have not yet reported any permitting activity. Figure 7 displays the roughly 29 parcels initially marked Red and the 73 parcels initially marked Yellow that have reported no relevant permitting activity since the debris flow. Additionally, over 200 parcels that were initially tagged Red or Yellow have projects that are still in progress. This suggests that the change in inspection status summarized in Figure 4 has been driven by demolitions, as opposed to homes being rebuilt/repaired.
The time between permit filings provides some insight on the timeline for reconstruction. For parcels that have been issued both demolition and subsequent repair/rebuild permits, the average time between their issuance was 120 days. Over one year after the initial mudslide event, only two rebuilding projects and 15repair projects have been completed. Although not all recovery efforts require a permit, such as for removing mud from property, our analysis indicates that Montecito’s housing stock still has a long road to recovery.
References
California Department of Insurance. (2018, April 2). Montecito mudslide insurance claims top $421 million. Retrieved from California Department of Insurance Website: http://www.insurance.ca.gov/0400-news/0100-press-releases/2018/release033-18.cfm
County of Santa Barbara Building & Safety. (2019, February 1). Red and Yellow Tag Fact Sheet. Retrieved from Ready Santa Barbara County Website: https://readysbc.org/rebuild/red-and-Yellow-tagging/
OpenStreetMap contributors. (2019). Planet dump from 14 February. Retrieved from OpenStreetMap: https://planet.openstreetmap.org
Robert D. Niehaus, Inc. (2019, March). Disaster Premiums in the Rental Housing Market: Exploring the Effect of the Montecito Debris Flow. Santa Barbara, CA. Retrieved from http://www.rdniehaus.com/rdn/
Santa Barbara County Assessor. (2019a, February 12). Total Tentative Impact on Debris Flow Properties 2018. Provided via email.
Santa Barbara County Assessor. (2019b, March). Recent Home Sales (Santa Barbara County). Retrieved from County Clerk, Recorder and Assessor Website: http://www.sbcvote.com/assessor/SearchPropertySales.aspx
Santa Barbara County Department of Planning & Development. (2019a, January 24). Interactive Map of Affected Properties. Retrieved from Ready Santa Barbara County Website: https://sbcopad.maps.arcgis.com/apps/webappviewer/index.html?id=c1df066590034bfc83f6b1d3d0ea94bf
Santa Barbara County Department of Planning & Development. (2019b, March 22). Lookup Permit History by Parcel. Retrieved from Planning & Development Website: http://sbcountyplanning.org/
Santa Barbara County Office of Emergency Management. (2018, December 3). Debris Flow Risk Areas. Retrieved from Ready Santa Barbara County Website: https://sbcoem.maps.arcgis.com/apps/webappviewer/index.html?id=2dfd558de56f45158b4f67ef678a24e3
Zillow. (2019, February 14). Monthly Home Sales. Retrieved from Zillow Data: https://www.zillow.com/research/data/