Year-over-Year Median Price up
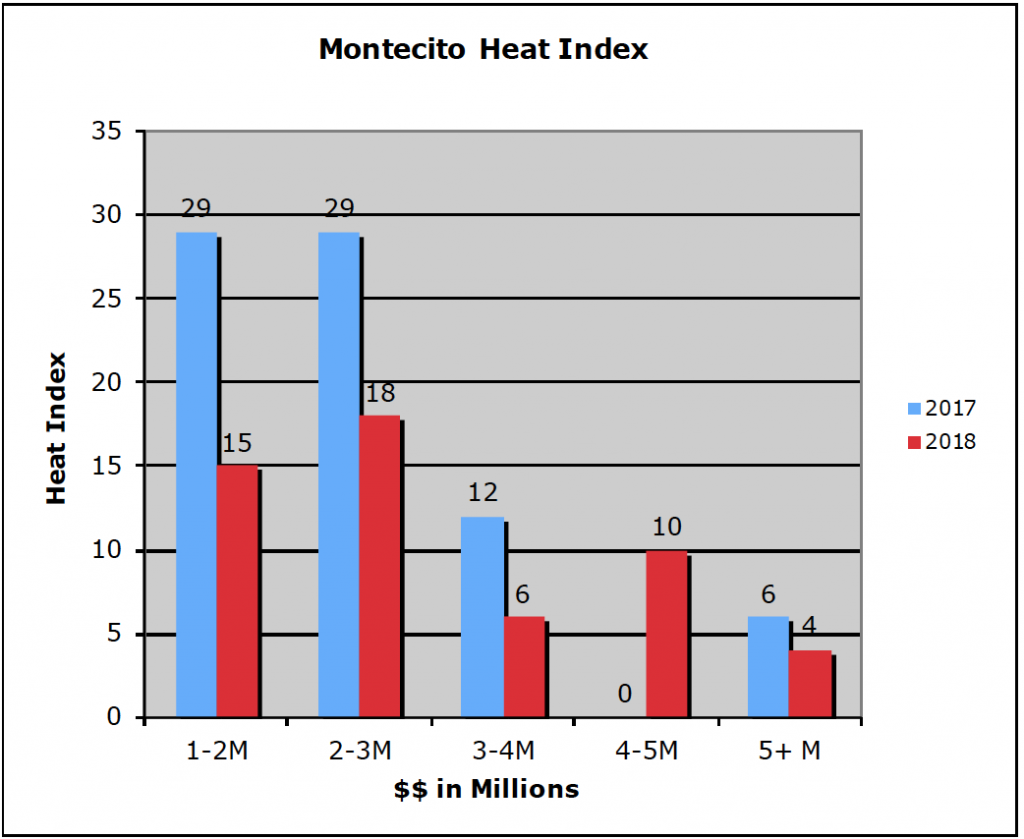
The Montecito Heat Index is a measurement of signed real estate purchase contracts, which are pending final closing for Montecito single-family homes in five distinct price sectors. This data, rather than closed sales, more closely measure present demand or Heat. And since real estate activity fluctuates, monthly and seasonally, today’s Heat score is compared to a year ago today.
All data are from the Santa Barbara MLS and are uniformly deemed reliable.
So how hot is our market? Today’s Heat Score is 53; last year’s was 76, a significant decrease of 83.3% and thus chilly at best.
In spite of our preoccupation last December with the Thomas Fire, Montecito ended the year with a median sale price of $3,380,800, a sizeable 11% increase over the prior year.
As the total Heat score reflects, buyer demand in January was at best weak. It is extraordinary actually given the mudflow disaster which began the morning of January 9, that there were any buyers at all. Looking at individual price sectors, and as the adjacent chart reflects, all but the $4-5-million sector underperformed compared to last year, and for the lower end $1-2M and $2-3M groups, demand was off 48.1% and 38.6%, respectively. Atypical numbers for our most in-demand sectors.
So, what will likely be the impact of the fire/mudflow disaster upon Montecito home prices? There are interesting reports to be found measuring impact on real estate prices following natural disasters.
In the short term, all disaster areas experienced sales below what was expected – some in the double digits. Once recovery began, there were different results. All locales are different, of course, and Montecito has always been a bit outside of the norm – yet, surprisingly, other higher-end, upscale, in-demand communities typically experienced not a sustained drop in home values, as might have been expected, but an increase.
Simply put, as the competition for undamaged homes increased, so did prices. A good example is Santa Rosa to the north, which experienced an increase in their home prices of nearly 10% following its fires at the end of last year. People didn’t leave. They liked their community and stayed and competed for homes. My guess is that will happen here as well.
<ADD GRAPH>
2017: 29, 29, 12, 0, 6
2018: 15, 18, 6, 10, 4
You might also be interested in...